“Participating with the Data for Good was a delightful highlight of my year, it truly is Data for Great!”
Jamie Mahase, CCC
Who is Childhood Cancer Canada?
Childhood Cancer Canada (CCC) is a foundation dedicated to fighting childhood cancer. It was founded in 1987. The foundation works to improve the lives of children with cancer and their families through its support programs and investment in collaborative cancer research. It has a partnership with all of Canada’s 17 childhood cancer hospitals and treatment centres.
CCC creates victories for Canadian children with cancer through investment in national, collaborative, lifesaving research, empowering education and community programs. The organization’s goal is to find a cure for all childhood cancers.
“Two years ago I started with a freshly converted NFP database with over 20 years of gift history which had multiple degrees of inconsistencies.”
Jamie Mahase, CCC
Problem we were asked to solve.
CCC asked that we achieve two high level goals using the data set provided
- Identify and analyze historical donor giving trends
- Analyze member demographics to potentially support targeted advertising campaigns, “Help us be more efficient about mailing.”
Examples of the kinds of insights CCC is looking for:
- How do donation amounts/rates vary (e.g. over time, channel, campaign, gift usage)?
- What is our donor retention rate (over a 1, 6, 12 month period)? Or (1, 3 and 5 years)?
- What are our top 10 donation areas?
- Can you identify individual donors most likely to convert into monthly donors?
- Where else can we find similar donors?
- Can you identify (potentially) duplicate records and/or fraudulent transactions?
“We first went through a data cleansing day which lead into the main event, the hack-a-thon. It was inspiring to witness dozens of genius professionals volunteer their time and knowledge, using complex coding and profound analytical proficiencies, shear through my data-set and produce presentations with invaluable insights and metrics that will help guide my Fundraising Team to build strategies into the foreseeable future.”
Jamie Mahase, CCC
What did the dataset look like?
CCC provided an extensive set of donation data spanning 23 columns and 600K+ rows of data. The donations go back to the year 2000 and each record consists of information regarding
- When the donation was obtained
- The amount of the donation
- How the donation was obtained
- Geographic location of the donation
- Other anonymized data about the donor
- Where the donation was directed if the donor chose to direct their donations
- The latest Census Data Set from Stats Can (to join with the member data by postal code)
After cleaning and preparing the donor data from CCC the resulting table including the following data types:
cols = [
    'userId',
    'userType',
    'postalCode',
    'giftDate',
    'depositDate',
    'giftType',
    'giftPaymentType',
    'giftReceipt',
    'giftCode',
    'giftAmount',
    'channelId',
    'channelDesc',
    'campaignId',
    'campaignDesc',
    'campaignHouse',
    'campaignProspect',
    'giftUsage:General',
    'giftUsage:Scholarship',
    'giftUsage:100%Fund',
    'giftUsage:Benevolent',
    'giftUsage:AmazingAdventure',
    'giftUsage:EmpowerPacks',
    'giftUsage:Research'
]
Additionally, StatsCan Forward Sorting Area tables were used to associate postal code information with their geographic areas in Canada.
Data set and tools we used to help
Additionally, StatsCan Forward Sorting Area tables were used to associate postal code information with their geographic areas in Canada.
Analysis and Key Findings
Who are our donors?
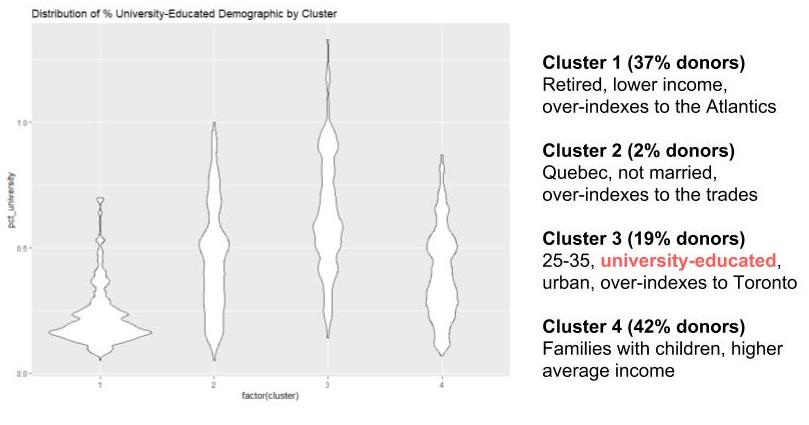
Principal Component Analysis (PCA) was used to determine this. PCA is a form of unsupervised learning to create a profile. PCA is a dimension-reduction tool that can be used to reduce a large set of variables to a small set that still contains most of the information in the large set. Below is how we performed PCA on the data set provided.
- Joined the donor data set with the Census dataset to pulling through variables that would help us determine the profile of target group such as marital status, ethnicity, education level, household income etc. The joining of the datasets allowed gives us the characteristics of all donors.
- We take our many variables and perform the PCA in R to reduce into 4 variables/clusters(“small set that still contains most of the information in the large set”)
- Looking at the results we determined that cluster 3 with 19% of the donors and 27% of the value is the cluster that deserves more attention. The profile of this cluster is
- 25-35 years old
- University Educated
- Living in Toronto
Distinguishing characteristics of donors who provide larger than average annual donation
- University educated
- Donate via the annual giving plan
- They pay by credit card
- Do not live in Atlantic Canada
- On average this group is donating $187
Fraud Detection
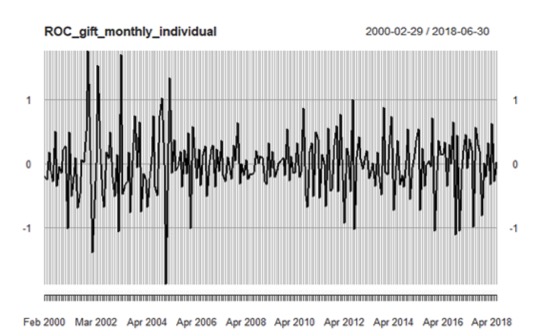
This graph visualizes the rate of change month-over-month for the data set.
While there were no specific incidents of fraud discovered in the dataset, CCC can use the graph to monitor incoming donations. When a donation surpasses the mean reversion line in either direction it is worthwhile investigating that specific donation.
Recommendations
- Focus marketing on target profile University educated people who participate in the annual giving plan and pay credit card.
- Continue to campaign long term donors to slowly increase their donations
- Partner with institutions and locations outside of the regular donor group to bring novelty to special event fundraising
- Continue to track and monitor where your donations are coming from as well as large and very small donations which warrant further investigation
“Thank you again, to all who volunteered their time and expertise, the Data for Good Teams (Toronto and Waterloo!) and everyone who takes that extra moment to pay-it-forward…. We will change the world, one data-set at a time.”
Jamie Mahase, CCC
Acknowledgements
Significant amounts of this case study came directly from the fantastic presentation by the Waterloo Chapter of Data For Good.