Problem/main challenges: The Retail Action Network (RAN) is a labour rights organization based out of Victoria, BC advocating for employees in the service sector. Primary areas of work include advocacy around livable wages and accountability for employers contravening provincial labour standards. The organization was looking to better understand survey data from their Grade My Boss online tool, which collects feedback from respondents related to working conditions. This information will be used to better design future iterations of the tool and inform strategic campaign work.
Recommendation and implementation plan: Data for Good Vancouver provided recommendations related to consistency and structure of data collection that will allow for more strategic use of data in service of the organization’s advocacy goals. Volunteers also recommended more plain-language survey questions that will help RAN collect data more effectively from its members and increase engagement.
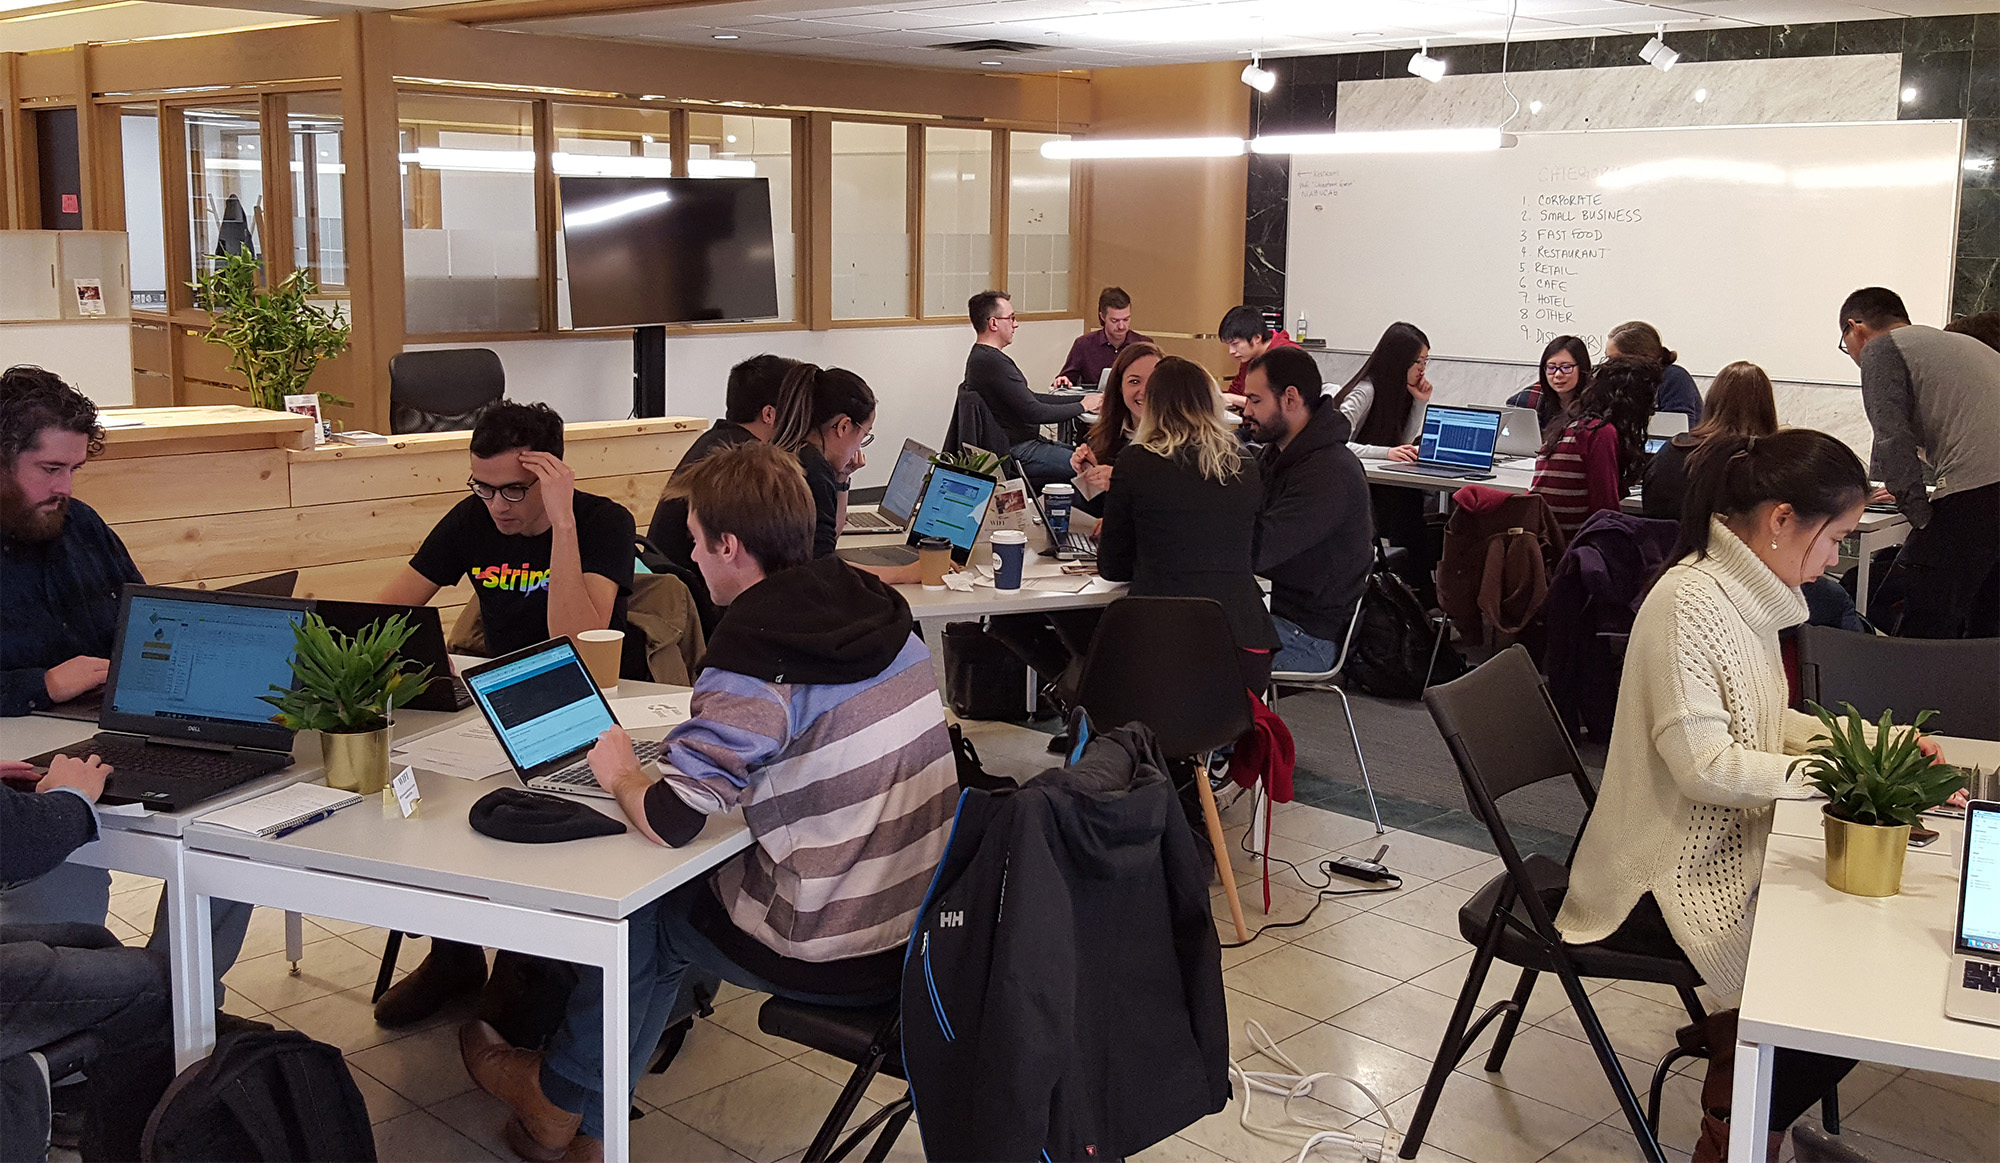
Data for Good volunteers at datathon for Retail Action Network
Next steps: RAN will be working with select members of Data for Good Vancouver to write a report to be published in May of 2019. Additionally, RAN will be developing a web app, and the analysis and findings of the datathon will be used to inform the organization’s ongoing data analysis related to this project.
Questions answered/impact made: Data for Good volunteers provided clarity on the prevalence of labour code infractions reported by respondents, along with the types of infractions that were more common among employers in the service sector. Analysis also described relationships between working conditions and various categories of employers. This work will help prioritize issues within the service sector for the Retail Action Network and help the organization focus their advocacy efforts to most effectively represent the interests of employees. Data for Good volunteers also suggested design enhancements to the Grade My Boss tool to improve communication of information. Current design elements were seen as ambiguous and difficult to interpret.
Data set and tools used: The data set contained survey data from 421 respondents who submitted information between April 2017 to January 2019 related to approximately 400 businesses. The businesses varied in size and were primarily located on Vancouver Island. Volunteers used a variety of analysis and visualization tools including, but not limited to, Python, R, and Tableau.
Google Drive/Github of slides, deliverables, data: Slides, data, infographics, and code provided to Retail Action Network for internal use.
Thank you to all the volunteers who made our datathon a huge success. Along with @RetailActionBC @thenetworkhub @chinatownhse @C12beer @Tayybeh1 and Matchstick Coffee.
@Data_for_Good pic.twitter.com/PKYd82YVNu
— Data for Good YVR (@dataforgoodyvr) February 11, 2019